Indicator predictions by market
For each market, the indicators whose LiveCharts.AI predictions have called the direction well. Based on LiveCharts.AI's recorded predictions compared with what the market actually did.
Nasdaq futures
- NQ Ichimoku Cloud prediction — direction right 78% (15 minute chart, 90 minutes ahead), +24% vs a simple guess
- NQ ADX / DMI prediction — direction right 63% (1 hour chart, 12 hours ahead), +18% vs a simple guess
- NQ Standard Deviation prediction — direction right 64% (1 hour chart, 12 hours ahead), +18% vs a simple guess
- NQ Williams Alligator prediction — direction right 96% (5 minute chart, 1 hour ahead), +18% vs a simple guess
- NQ Bollinger Bands prediction — direction right 68% (1 hour chart, 12 hours ahead), +12% vs a simple guess
- NQ Parabolic SAR prediction — direction right 99% (15 minute chart, 30 minutes ahead), +11% vs a simple guess
- NQ Volume Weighted Moving Average (VWMA) prediction — direction right 74% (15 minute chart, 3 hours ahead), +6% vs a simple guess
S&P 500 futures
- ES Ichimoku Cloud prediction — direction right 74% (1 hour chart, 6 hours ahead), +28% vs a simple guess
- ES Standard Deviation prediction — direction right 71% (1 hour chart, 12 hours ahead), +23% vs a simple guess
- ES Williams Alligator prediction — direction right 94% (15 minute chart, 3 hours ahead), +20% vs a simple guess
- ES Parabolic SAR prediction — direction right 95% (1 hour chart, 6 hours ahead), +14% vs a simple guess
- ES ATR prediction — direction right 61% (1 hour chart, 12 hours ahead), +13% vs a simple guess
- ES Bollinger Bands prediction — direction right 74% (15 minute chart, 90 minutes ahead), +13% vs a simple guess
- ES ADX / DMI prediction — direction right 58% (5 minute chart, 1 hour ahead), +12% vs a simple guess
- ES Volume Weighted Moving Average (VWMA) prediction — direction right 76% (1 hour chart, 12 hours ahead), +6% vs a simple guess
- ES Simple Moving Average (SMA) prediction — direction right 83% (1 hour chart, 6 hours ahead), +6% vs a simple guess
Crude oil futures
- CL Williams Alligator prediction — direction right 91% (1 hour chart, 12 hours ahead), +26% vs a simple guess
- CL Ichimoku Cloud prediction — direction right 67% (15 minute chart, 3 hours ahead), +25% vs a simple guess
- CL ADX / DMI prediction — direction right 61% (1 hour chart, 12 hours ahead), +17% vs a simple guess
- CL Bollinger Bands prediction — direction right 72% (5 minute chart, 1 hour ahead), +14% vs a simple guess
- CL Standard Deviation prediction — direction right 64% (15 minute chart, 3 hours ahead), +14% vs a simple guess
- CL Volume Weighted Moving Average (VWMA) prediction — direction right 68% (1 hour chart, 12 hours ahead), +13% vs a simple guess
- CL Parabolic SAR prediction — direction right 97% (1 hour chart, 6 hours ahead), +10% vs a simple guess
- CL Simple Moving Average (SMA) prediction — direction right 80% (5 minute chart, 30 minutes ahead), +9% vs a simple guess
- CL Keltner Channel prediction — direction right 62% (1 hour chart, 12 hours ahead), +5% vs a simple guess
Gold futures
- GC Ichimoku Cloud prediction — direction right 79% (15 minute chart, 90 minutes ahead), +31% vs a simple guess
- GC Williams Alligator prediction — direction right 96% (15 minute chart, 3 hours ahead), +18% vs a simple guess
- GC ADX / DMI prediction — direction right 62% (15 minute chart, 3 hours ahead), +16% vs a simple guess
- GC Standard Deviation prediction — direction right 60% (15 minute chart, 3 hours ahead), +15% vs a simple guess
- GC Bollinger Bands prediction — direction right 78% (5 minute chart, 1 hour ahead), +14% vs a simple guess
- GC Parabolic SAR prediction — direction right 93% (1 hour chart, 6 hours ahead), +13% vs a simple guess
- GC Momentum prediction — direction right 62% (15 minute chart, 30 minutes ahead), +5% vs a simple guess
- GC Volume Weighted Moving Average (VWMA) prediction — direction right 74% (1 hour chart, 12 hours ahead), +4% vs a simple guess
- GC Simple Moving Average (SMA) prediction — direction right 82% (1 hour chart, 6 hours ahead), +4% vs a simple guess
Silver futures
- SI Ichimoku Cloud prediction — direction right 74% (15 minute chart, 90 minutes ahead), +29% vs a simple guess
- SI Standard Deviation prediction — direction right 66% (15 minute chart, 3 hours ahead), +20% vs a simple guess
- SI ADX / DMI prediction — direction right 66% (15 minute chart, 3 hours ahead), +19% vs a simple guess
- SI Williams Alligator prediction — direction right 94% (1 hour chart, 12 hours ahead), +18% vs a simple guess
- SI Bollinger Bands prediction — direction right 76% (5 minute chart, 1 hour ahead), +9% vs a simple guess
- SI Parabolic SAR prediction — direction right 98% (15 minute chart, 90 minutes ahead), +9% vs a simple guess
- SI Momentum prediction — direction right 61% (15 minute chart, 30 minutes ahead), +5% vs a simple guess
Dow futures
- YM Ichimoku Cloud prediction — direction right 74% (1 hour chart, 6 hours ahead), +28% vs a simple guess
- YM Williams Alligator prediction — direction right 93% (1 hour chart, 12 hours ahead), +24% vs a simple guess
- YM ADX / DMI prediction — direction right 66% (5 minute chart, 1 hour ahead), +22% vs a simple guess
- YM ATR prediction — direction right 61% (1 hour chart, 12 hours ahead), +15% vs a simple guess
- YM Standard Deviation prediction — direction right 66% (5 minute chart, 30 minutes ahead), +14% vs a simple guess
- YM Parabolic SAR prediction — direction right 99% (1 hour chart, 2 hours ahead), +13% vs a simple guess
- YM Bollinger Bands prediction — direction right 72% (5 minute chart, 1 hour ahead), +8% vs a simple guess
- YM Volume Weighted Moving Average (VWMA) prediction — direction right 83% (5 minute chart, 30 minutes ahead), +7% vs a simple guess
- YM Keltner Channel prediction — direction right 69% (5 minute chart, 1 hour ahead), +6% vs a simple guess
Natural gas futures
- NG Ichimoku Cloud prediction — direction right 69% (5 minute chart, 30 minutes ahead), +35% vs a simple guess
- NG Standard Deviation prediction — direction right 66% (5 minute chart, 1 hour ahead), +22% vs a simple guess
- NG Bollinger Bands prediction — direction right 75% (1 hour chart, 12 hours ahead), +18% vs a simple guess
- NG ADX / DMI prediction — direction right 60% (5 minute chart, 1 hour ahead), +18% vs a simple guess
- NG Williams Alligator prediction — direction right 98% (15 minute chart, 90 minutes ahead), +18% vs a simple guess
- NG Parabolic SAR prediction — direction right 99% (15 minute chart, 30 minutes ahead), +9% vs a simple guess
- NG Keltner Channel prediction — direction right 62% (15 minute chart, 3 hours ahead), +7% vs a simple guess
- NG Awesome Oscillator prediction — direction right 72% (1 hour chart, 12 hours ahead), +6% vs a simple guess
- NG Stochastics prediction — direction right 67% (1 hour chart, 6 hours ahead), +5% vs a simple guess
- NG Momentum prediction — direction right 63% (5 minute chart, 10 minutes ahead), +5% vs a simple guess
Bitcoin futures
- MBT Ichimoku Cloud prediction — direction right 66% (1 hour chart, 6 hours ahead), +27% vs a simple guess
- MBT Standard Deviation prediction — direction right 70% (15 minute chart, 3 hours ahead), +27% vs a simple guess
- MBT Williams Alligator prediction — direction right 95% (1 hour chart, 12 hours ahead), +22% vs a simple guess
- MBT Bollinger Bands prediction — direction right 71% (1 hour chart, 12 hours ahead), +15% vs a simple guess
- MBT ADX / DMI prediction — direction right 61% (1 hour chart, 6 hours ahead), +12% vs a simple guess
- MBT Momentum prediction — direction right 71% (5 minute chart, 30 minutes ahead), +11% vs a simple guess
- MBT Parabolic SAR prediction — direction right 99% (5 minute chart, 10 minutes ahead), +11% vs a simple guess
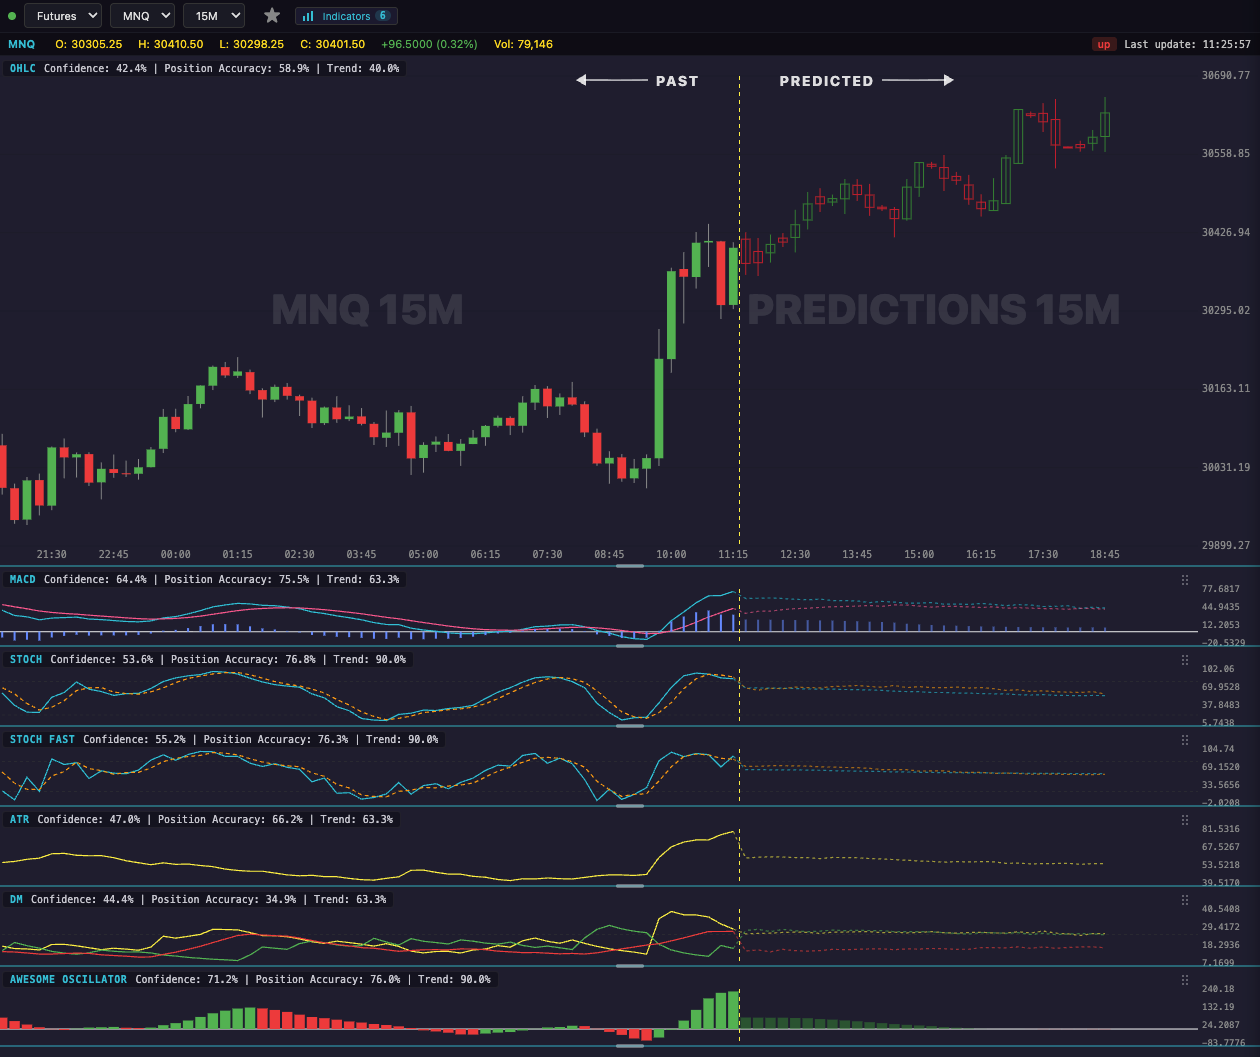
See LiveCharts.AI in action — predicted candlesticks and indicators, 30 bars into the future, before they occur:
More questions traders ask
Silver futures live Open the SI chart on LiveCharts.AI to see where Silver futures is now and where its next 30 candles are predicted to go. Past SI predictions are published next to what the market actually did. Silver futures predictions →
Silver futures trading For Silver futures, LiveCharts.AI draws predicted candlesticks and indicators to the right of the live price, and its AI chat answers questions about the SI chart. Predictions are estimates, not certainties. Silver futures predictions →
Mini silver futures LiveCharts.AI predicts the path of Silver futures (SI) 30 bars ahead on every timeframe and shows how recent predictions compared with what happened, so the record can be checked before relying on one. Silver futures predictions →