LiveCharts.AI plots live candlestick charts with AI-generated forward forecasts for Futures, Forex, Crypto and Stocks — multi-timeframe, multi-indicator.
View multiple Charts, Frames, Instruments and Indicator Predictions simultaneously.
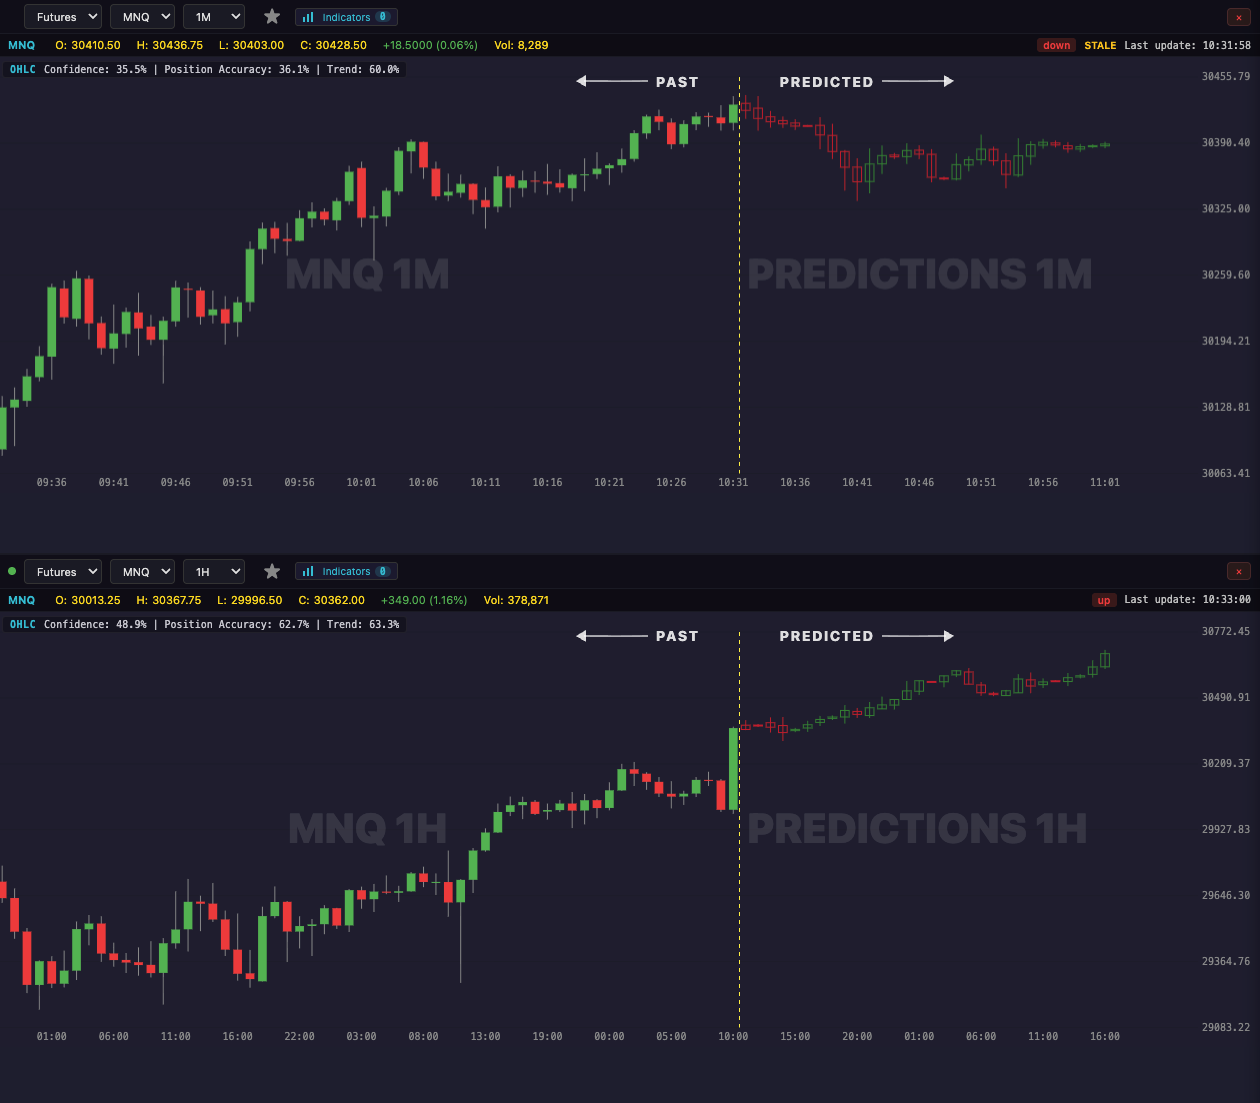
Example below: viewing MNQ 1-Minute and MNQ 1-Hour future predictions simultaneously…
Stack every indicator below your chart — each one forecast 30 bars forward.
Example below: MNQ 15-Minute with MACD, ATR, Stochastics, and Awesome Oscillator panels…
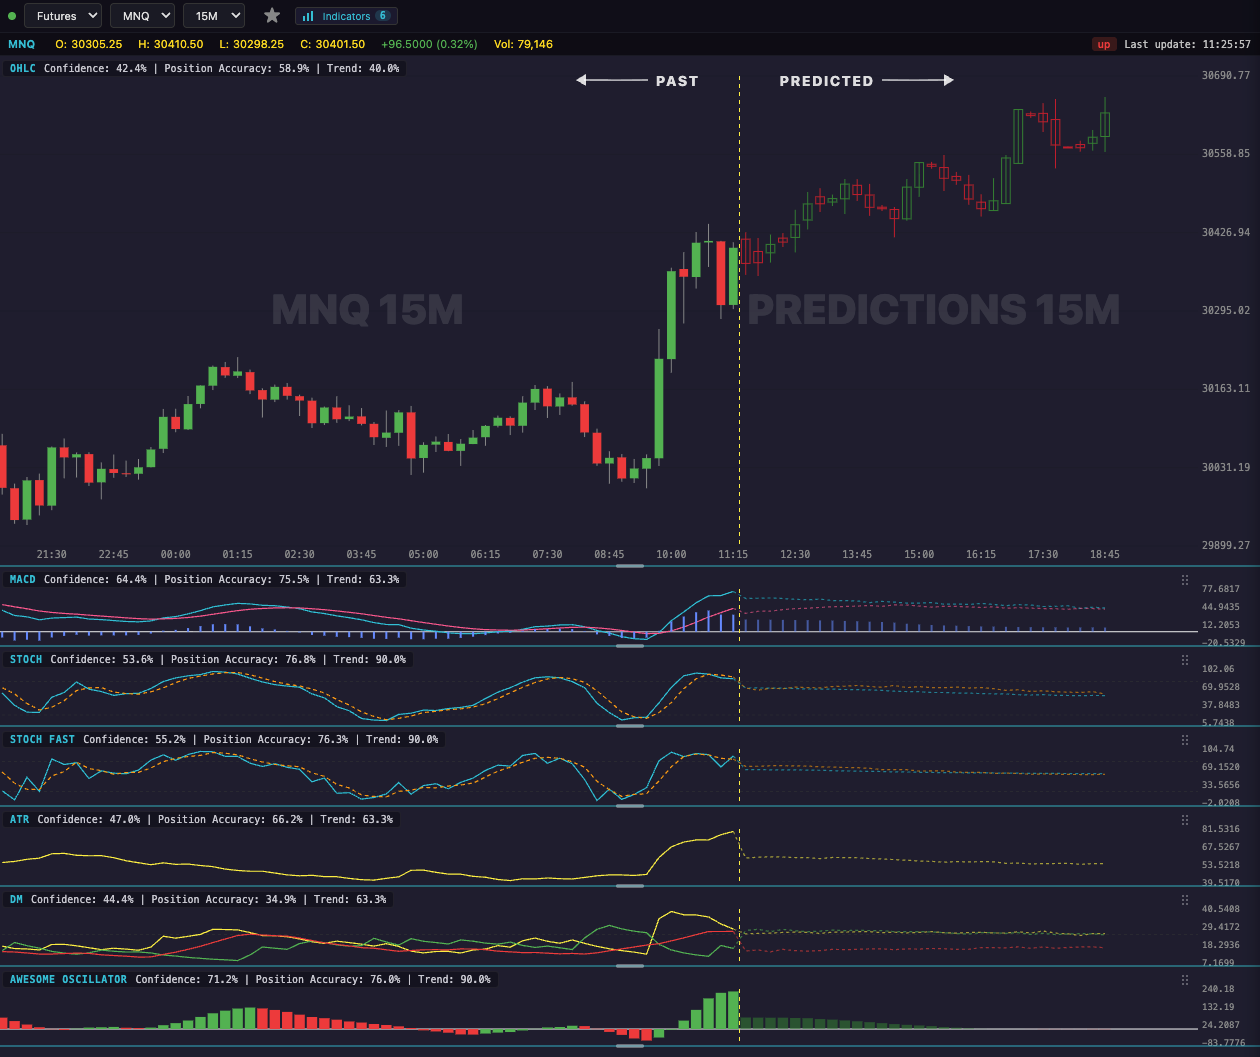
LiveCharts.AI doesn't just forecast price — every technical indicator you enable is itself projected 30 bars into the future alongside the candles. The historical reading flows continuously into its predicted trajectory, so you see exactly where each indicator is heading before the bar prints.
Trend strength and momentum. MACD, Signal, and Histogram all forecast 30 bars ahead.
Overbought / oversold momentum. Both %K and %D projected forward through the 30-bar horizon.
Faster oscillator for short-term momentum shifts. Same 30-bar forecast horizon.
Volatility gauge. The next 30 bars' expected range is forecast, not just the current reading.
Trend strength and direction (ADX) with the +DI/-DI battle. All three lines forecast forward.
Momentum vs. its own recent history. The next 30 bars of momentum direction are projected, not just inferred.
Visuals above are illustrative. Live indicator panels in the app render against real prediction data and update continuously.
Charts that show you what just happened — and what the model says is coming next.
Every chart shows the next 30 bars as predicted candles alongside the live ones. Hollow bodies mark forecast; solid bodies mark realized.
Stack 1m, 5m, 15m, 30m, 45m, and 1h frames side by side. Pan, pinch-zoom, and stretch each axis with TradingView-style controls.
Toggle MACD, Stochastics, ATR, DM, and Awesome Oscillator panels. Each indicator is forecast forward 30 bars alongside the price.
The instrument picker only ever shows what the backend is actively producing. No phantom instruments, no stale options — what you see is what's available right now.
No install. No plugin. Open the chart on a Mac, PC, iPad, or phone, and you're in.
Three stages from market data to your screen.
Tick-by-tick price data streams from connected trading platforms into our prediction engine.
For each instrument and frame, the model produces a 30-bar forward forecast for OHLC plus every active indicator.
Predictions arrive at your chart within seconds of being generated. Stay focused on price action — the model handles the math.
Everything LiveCharts.AI offers, included. Start with a 3-day free trial.
Start your 3-day free trial today — cancel anytime.
Start Free TrialStart your free trial today.
Register Now