Gold Futures (GC, MGC) — Live Chart & Prediction
Gold futures — GC on COMEX and MGC (Micro Gold, one tenth the size) — on a live chart, with LiveCharts.AI's prediction of where the price goes next on every timeframe, from 1 minute to 1 hour.
Gold futures live chart
Updated Nov 3, 5:30 PM ET. Open the live chart with every timeframe and the prediction drawn on it:
Open the live gold futures chart →Gold futures prediction for today and tomorrow
🔒 Where gold futures are predicted to go next
LiveCharts.AI predicts the next 30 bars of GC and MGC on every timeframe. On the 1 hour chart that reaches about 30 trading hours ahead — through tomorrow's session; on the 15 minute chart it covers the rest of today. The live prediction, its confidence and its direction are in the app.
See today's and tomorrow's gold futures prediction →A recent 15 minute GC prediction vs what actually happened
Made Nov 3, 12:15 AM ET with GC at 3,937, the prediction said GC would be lower 90 minutes later (3,922). GC was at 3,928 — the direction the prediction called.
How often the gold futures prediction gets the direction right
Gold futures prediction by timeframe
| Chart | Prediction | GC direction right | MGC |
|---|---|---|---|
| 15 minute chart | 90 minutes ahead | 58% | 59% |
| 5 minute chart | 1 hour ahead | 58% | 56% |
| 45 minute chart | 90 minutes ahead | 57% | 51% |
| 1 minute chart | 12 minutes ahead | 57% | 59% |
| 1 hour chart | 4 hours ahead | 55% | 56% |
Based on LiveCharts.AI's recorded predictions compared with what the market actually did.
Questions traders ask about gold futures
Where will gold futures be tomorrow? Nobody knows for certain. LiveCharts.AI's 1 hour prediction shows the path it predicts through tomorrow's session, with a confidence score — and this page shows how recent predictions compared with what actually happened.
GC or MGC? Both follow the same market; LiveCharts.AI predicts each on every timeframe.
Gold futures price, gold futures today, gold futures live? This page shows gold futures (GC, MGC) on a live chart and how LiveCharts.AI's recent predictions compared with what actually happened. Today's and tomorrow's prediction is in the LiveCharts.AI app.
MGC price prediction, GC futures prediction, micro gold futures prediction? LiveCharts.AI's gold futures prediction (GC, MGC) shows where the price is predicted to go over the next 30 bars, on every timeframe from 1 minute to 1 hour, in the LiveCharts.AI app. This page shows how often its recent predictions got the direction right.
More: GC prediction accuracy by timeframe · MGC · GC prediction vs actual, every day · Gold futures indicator predictions · All markets
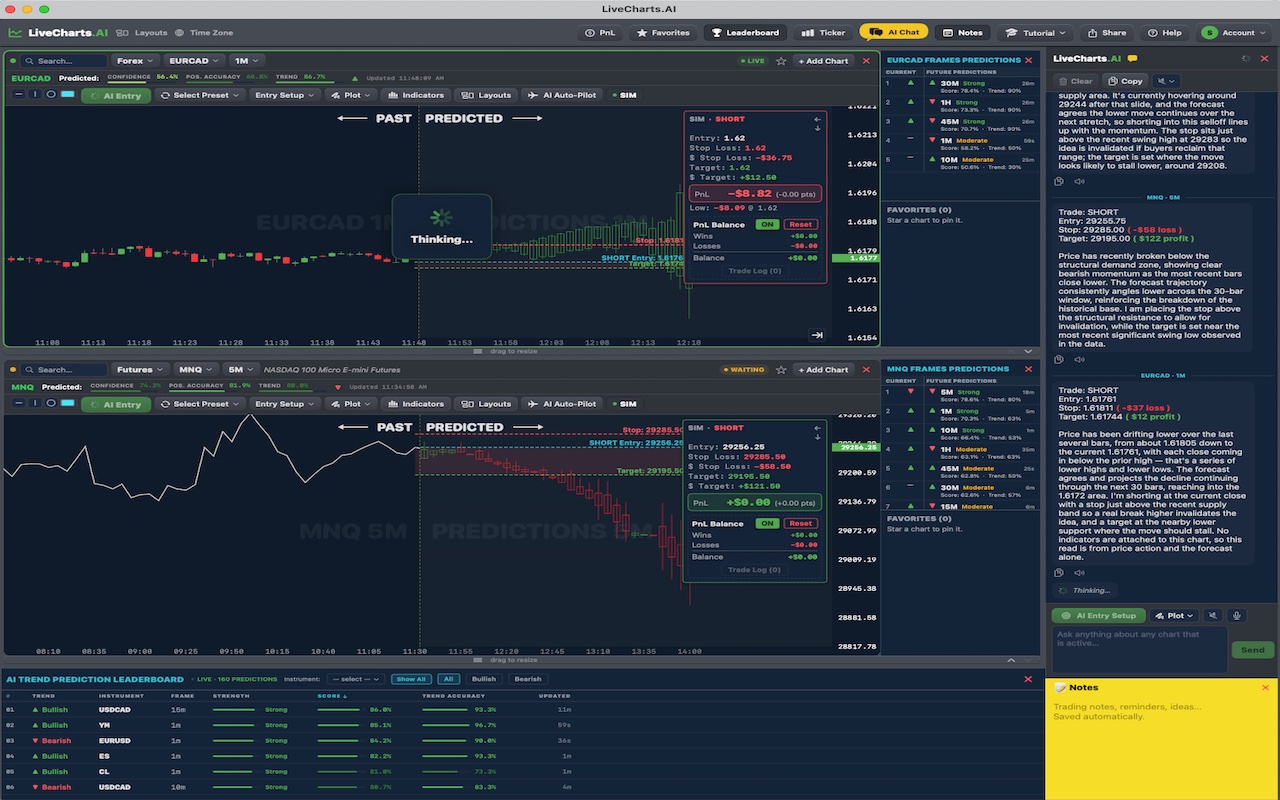
See LiveCharts.AI in action — predicted candlesticks and indicators, 30 bars into the future, before they occur:
More questions traders ask
Gold share price chart On LiveCharts.AI the Gold futures chart carries its own prediction: candlesticks and indicators 30 bars ahead, before they occur, with recent GC predictions shown next to what happened. Gold futures predictions →
Cbot gold LiveCharts.AI predicts the path of Gold futures (GC) 30 bars ahead on every timeframe and shows how recent predictions compared with what happened, so the record can be checked before relying on one. Gold futures predictions →
GC gold futures For Gold futures, LiveCharts.AI draws predicted candlesticks and indicators to the right of the live price, and its AI chat answers questions about the GC chart. Predictions are estimates, not certainties. Gold futures predictions →