LiveCharts.AI › Timeframes › 1 Minute
What does LiveCharts.AI read best on a 1 minute chart?
Every reading LiveCharts.AI projects on the 1 minute chart, ranked by measured accuracy.
| Reading | Median directional | Best | Charts |
|---|---|---|---|
| ATR | 81.7% | 98.0% | 14 |
| Awesome Oscillator | 76.7% | 98.0% | 21 |
| Bollinger | 98.0% | 98.0% | 19 |
| CCI | 73.3% | 98.0% | 10 |
| DM | 80.0% | 98.0% | 18 |
| EMA | 98.0% | 98.0% | 22 |
| Ichimoku Cloud | 98.0% | 98.0% | 11 |
| Keltner Channel | 98.0% | 98.0% | 20 |
| MACD | 83.3% | 98.0% | 17 |
| MAMA | 98.0% | 98.0% | 18 |
| Momentum | 86.7% | 96.7% | 13 |
| Price | 83.3% | 98.0% | 16 |
| Parabolic SAR | 86.7% | 98.0% | 13 |
| Price Action Oscillator | 71.7% | 90.0% | 8 |
| RSI | 63.3% | 83.3% | 9 |
| SMA | 98.0% | 98.0% | 21 |
| Std Dev | 98.0% | 98.0% | 13 |
| Stochastics | 80.0% | 98.0% | 12 |
| Stochastics Fast | 76.7% | 98.0% | 9 |
| VWMA | 98.0% | 98.0% | 17 |
| Williams R | 70.0% | 98.0% | 11 |
| Wiseman Alligator | 98.0% | 98.0% | 23 |
Median and best directional accuracy. “Charts” is how many qualifying charts fed each row — the sample size behind the median, not a page count. Measured, not estimated.
On the 1 minute chart the strongest reading by median directional accuracy is Bollinger at 98.0%.
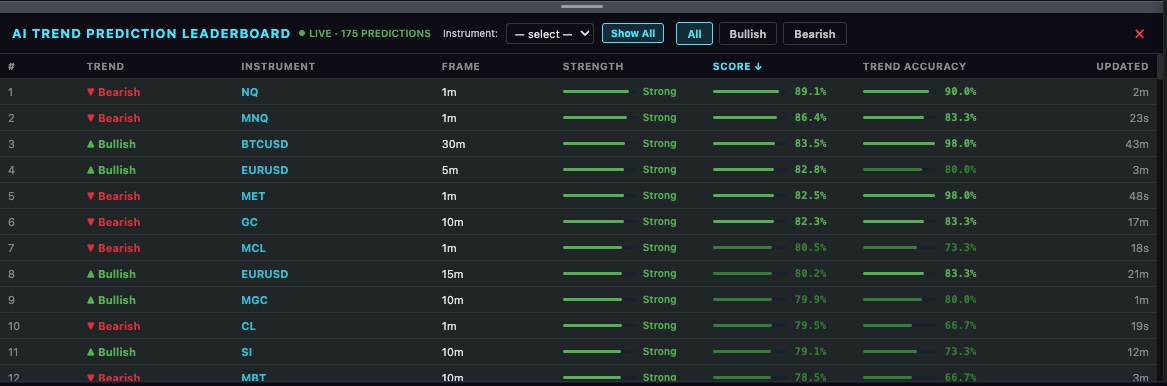
What these numbers are
Directional accuracy is how often the projected direction proved correct, measured against what price actually did. It is not a claim about future performance. The predictions themselves are produced inside the platform.
See the live predictions — 7 day free trialSee live predictions on LiveCharts.AI →
LiveCharts.AI disclaimer: trading involves risk of substantial loss and is not suitable for every investor. LiveCharts.AI provides technical analysis tools and predictions for educational and informational purposes only; outcomes vary and individual results may differ from any examples shown. Historical performance is not indicative of future outcomes. Only invest capital you can afford to lose and consult a licensed financial advisor before making investment decisions.