RTY (Russell 2000 E-mini Futures) 30 Minute prediction accuracy
Measured accuracy for each reading LiveCharts.AI projects on this chart.
See live predictions on LiveCharts.AI →
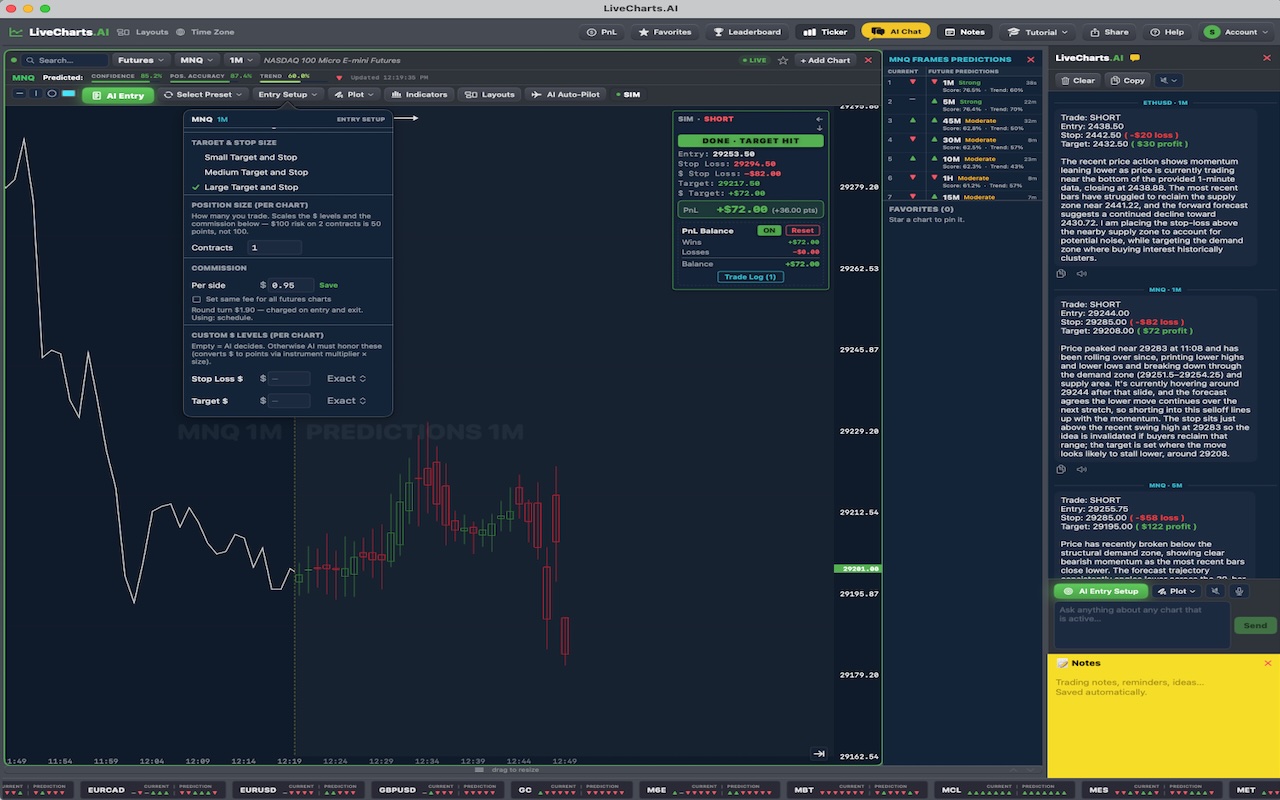
See LiveCharts.AI in action — predicted candlesticks and indicators, 30 bars into the future, before they occur:
Questions traders ask
Live 30 minute price range prediction Yes. LiveCharts.AI predicts RTY on the 30 minute chart as on every timeframe from 1 minute to 1 hour, with the predicted indicators beside the predicted candles. Candlestick prediction →
Russell 2000 E-mini Futures current market outlook AI LiveCharts.AI predicts the RTY path for the rest of today and tomorrow on every timeframe. It is a prediction, not a certainty; the market page shows how recent ones turned out. Market prediction page →
Russell 2000 E-mini Futures explain what this chart means LiveCharts.AI is an AI chart reader and analyzer: on the RTY chart it shows the predicted next 30 bars and the predicted indicators, and answers questions about the chart. AI chart analysis →
More questions traders ask
Russell 2000 futures For Russell 2000 E-mini Futures, LiveCharts.AI draws predicted candlesticks and indicators to the right of the live price, and its AI chat answers questions about the RTY chart. Predictions are estimates, not certainties. Russell 2000 E-mini Futures predictions →
Micro RTY futures Russell 2000 E-mini Futures (RTY) is live on LiveCharts.AI with the next 30 bars predicted on every timeframe from 1 minute to 1 hour, redrawn as each candle closes. A prediction is an estimate, not a certainty; the market page shows recent RTY predictions next to what happened. Russell 2000 E-mini Futures predictions →
Russell micro futures Open the RTY chart on LiveCharts.AI to see where Russell 2000 E-mini Futures is now and where its next 30 candles are predicted to go. Past RTY predictions are published next to what the market actually did. Russell 2000 E-mini Futures predictions →