RTY (Russell 2000 E-mini Futures) 10 Minute prediction accuracy
Measured accuracy for each reading LiveCharts.AI projects on this chart.
See live predictions on LiveCharts.AI →
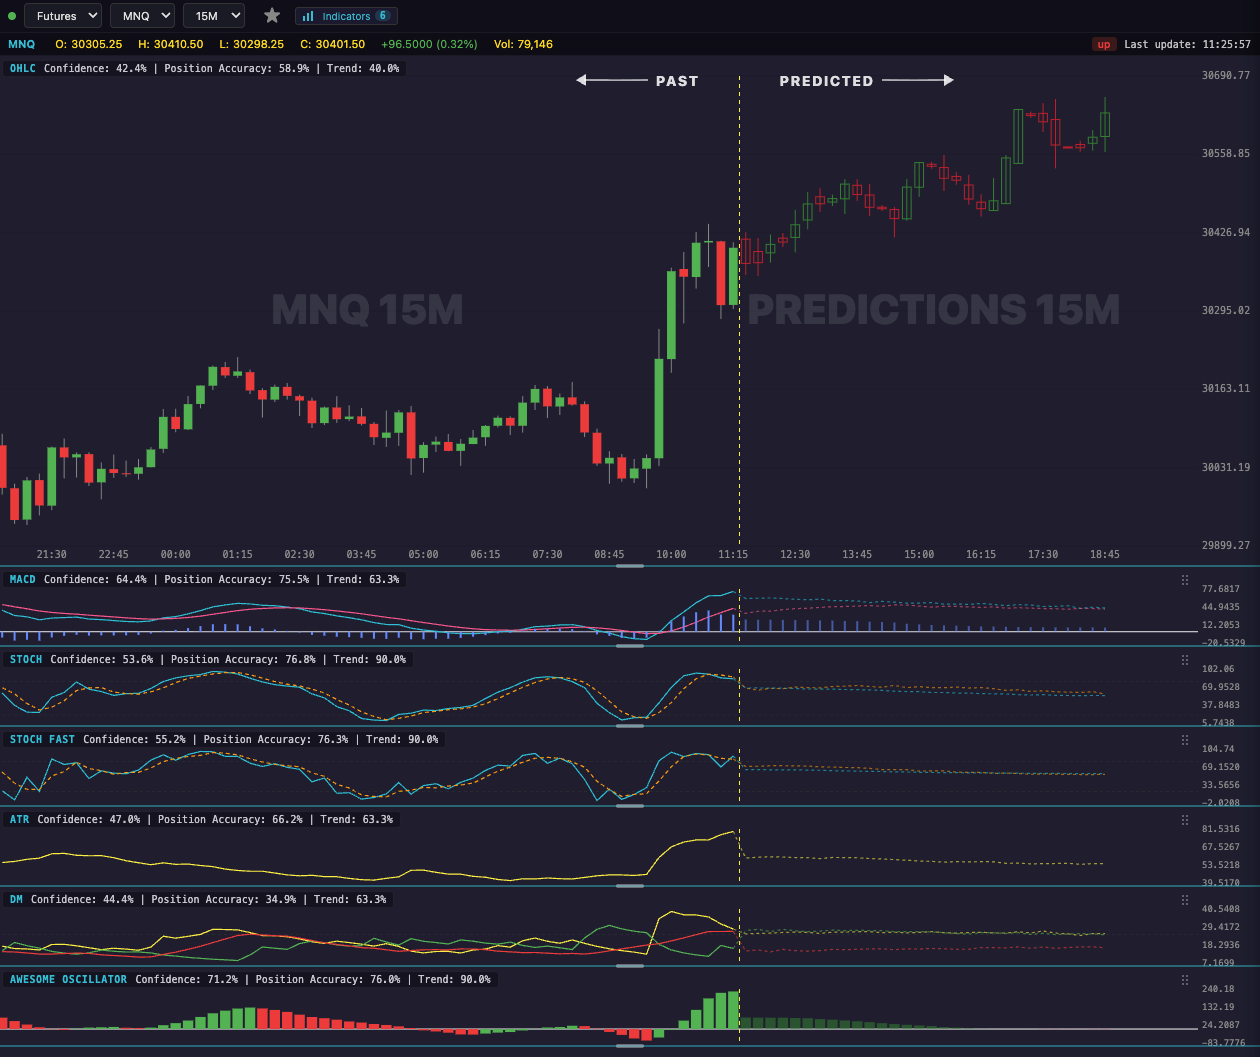
See LiveCharts.AI in action — predicted candlesticks and indicators, 30 bars into the future, before they occur:
Questions traders ask
Is the 10 minute chart bullish for day trading? On the 10 minute RTY chart LiveCharts.AI predicts the next 30 candles, about 5 hours ahead, and redraws them as each 10 minute candle closes. Candlestick prediction →
Can AI dynamic next bar prediction on RTY? LiveCharts.AI predicts the next 30 candles of Russell 2000 E-mini Futures on every timeframe from 1 minute to 1 hour, drawn on the live chart. It is a prediction, not a certainty, so LiveCharts.AI publishes how its recent RTY predictions compared with what happened. Candlestick prediction →
Best AI tool for intraday RTY charts? For day trading Russell 2000 E-mini Futures, LiveCharts.AI predicts the next candles on the 1, 5, 10 and 15 minute charts and redraws the prediction as each bar closes, so you see when it changes during the session. AI tools for day traders →
More questions traders ask
Russell 2000 futures live Russell 2000 E-mini Futures (RTY) is live on LiveCharts.AI with the next 30 bars predicted on every timeframe from 1 minute to 1 hour, redrawn as each candle closes. A prediction is an estimate, not a certainty; the market page shows recent RTY predictions next to what happened. Russell 2000 E-mini Futures predictions →
E-mini russell 2000 futures symbol LiveCharts.AI predicts the path of Russell 2000 E-mini Futures (RTY) 30 bars ahead on every timeframe and shows how recent predictions compared with what happened, so the record can be checked before relying on one. Russell 2000 E-mini Futures predictions →
RTY micro futures For Russell 2000 E-mini Futures, LiveCharts.AI draws predicted candlesticks and indicators to the right of the live price, and its AI chat answers questions about the RTY chart. Predictions are estimates, not certainties. Russell 2000 E-mini Futures predictions →