ES (S&P 500 E-mini Futures) 10 Minute prediction accuracy
Measured accuracy for each reading LiveCharts.AI projects on this chart.
See live predictions on LiveCharts.AI →
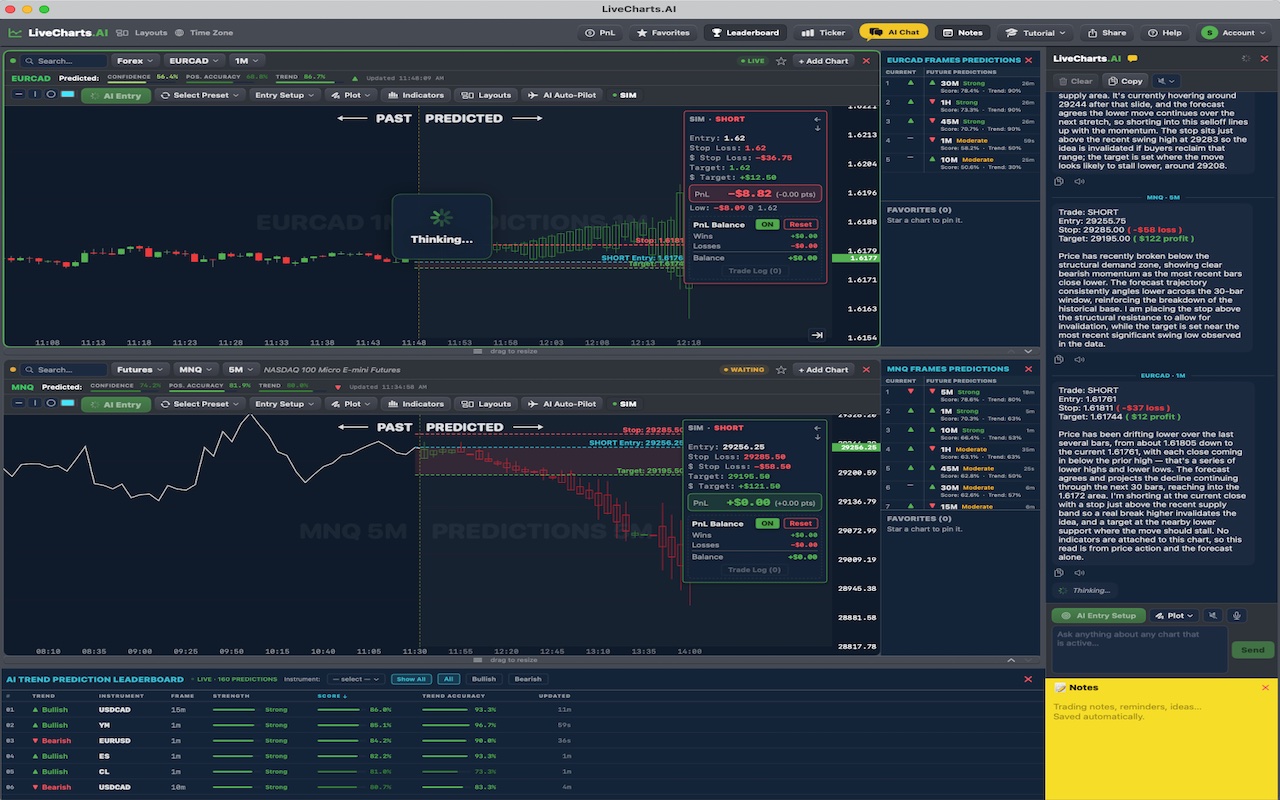
See LiveCharts.AI in action — predicted candlesticks and indicators, 30 bars into the future, before they occur:
Questions traders ask
What is the predicted low of the next 10 minute ES candle? On the 10 minute ES chart LiveCharts.AI predicts the next 30 candles, about 5 hours ahead, and redraws them as each 10 minute candle closes. Candlestick prediction →
ES measure predicted candle error AI can give a prediction for ES, not a certainty. LiveCharts.AI shows its measured record on S&P 500 E-mini Futures next to each prediction, so its reliability can be checked. Can AI predict futures prices? →
Is there a ES chart that displays AI predictions? LiveCharts.AI is an AI charting and prediction app built for futures day traders: live ES charts, predicted candles up to 30 bars ahead and an AI chat that explains the chart, on web, iPhone, iPad and Mac. Futures prediction app →
More questions traders ask
F stock price Open the ES chart on LiveCharts.AI to see where S&P 500 E-mini Futures is now and where its next 30 candles are predicted to go. Past ES predictions are published next to what the market actually did. S&P 500 E-mini Futures predictions →
Paper trading on chart The LiveCharts.AI ES chart shows the real S&P 500 E-mini Futures candles together with the predicted next 30 candles and the predicted indicators, drawn ahead of the last bar on every timeframe from 1 minute to 1 hour. S&P 500 E-mini Futures predictions →
Asian markets live LiveCharts.AI predicts the path of S&P 500 E-mini Futures (ES) 30 bars ahead on every timeframe and shows how recent predictions compared with what happened, so the record can be checked before relying on one. S&P 500 E-mini Futures predictions →