ES (S&P 500 E-mini Futures) 1 Minute EMA Prediction Accuracy
E-mini S&P 500 — how LiveCharts.AI predictions for EMA on the 1 minute chart have measured up.
| Prediction direction | View live → |
| LiveCharts.AI confidence | 57.4% |
| Position accuracy | 80.2% |
| Directional accuracy | 98.0% |
These are measured outcomes, not estimates. Position accuracy of 80.2% reflects how closely the projected path tracked what EMA actually did; directional accuracy of 98.0% reflects how often the projected direction was right.
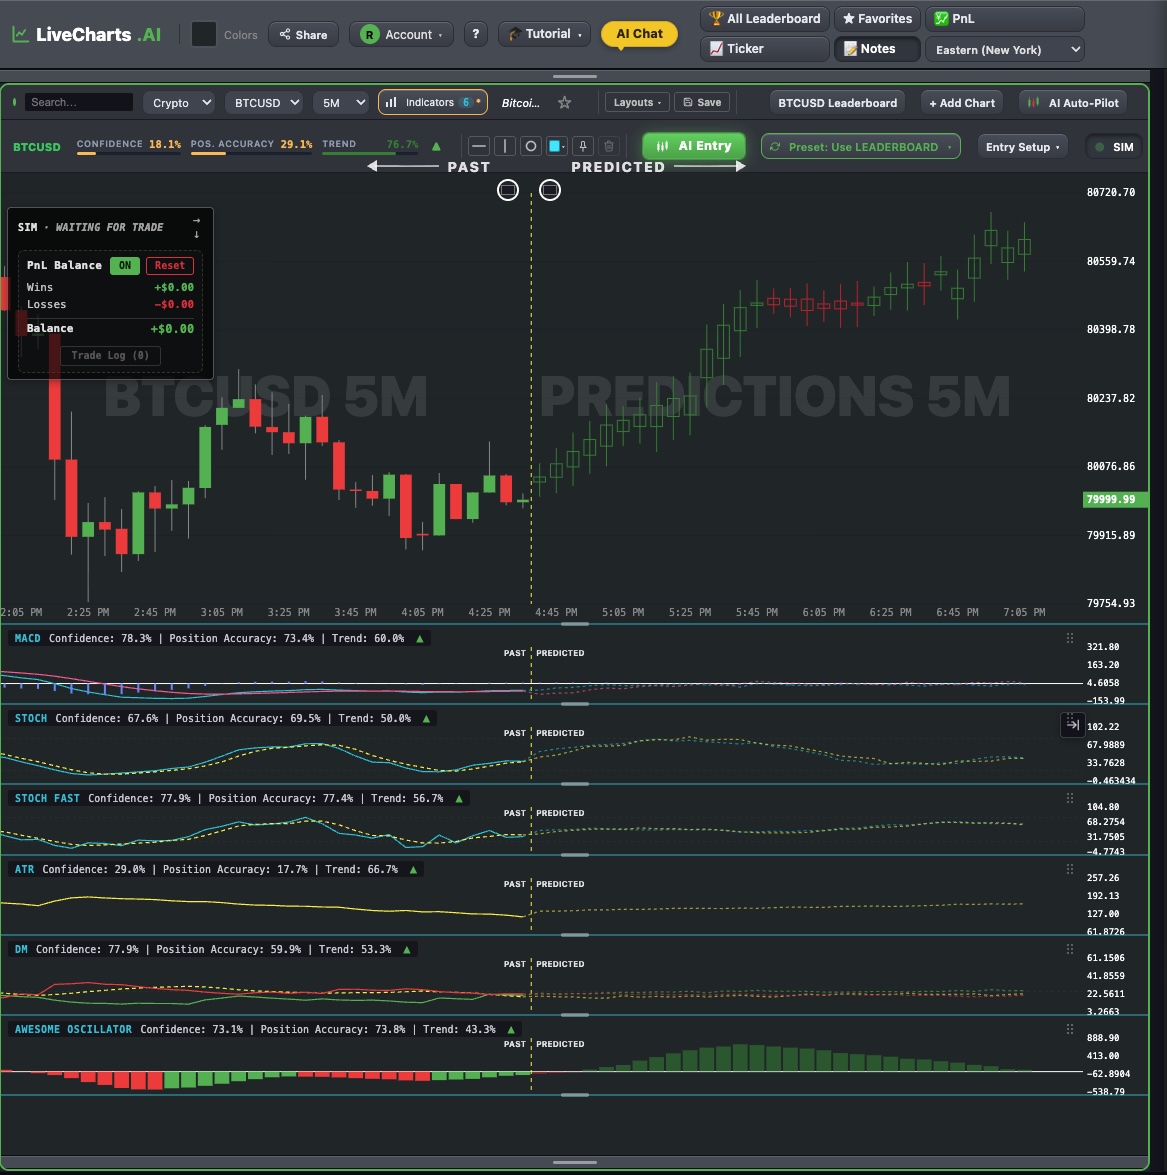
LiveCharts.AI projecting EMA and price forward on a live chart.
What this reading is
The exponential moving average weights recent bars more heavily, so it follows price closely while smoothing out single bar noise. On directional accuracy this ranks 1 of 18 readings on this chart, in line with the median of 98.0%.
Why the timeframe changes the read
The same prediction reads differently depending on the chart you act on. A slower frame sets context; a faster one decides timing. E-mini S&P 500 on the 1 minute chart is one view of EMA, and comparing it against the other frames below is usually more useful than any single number.
How the prediction is produced
Rather than only plotting what has already happened, LiveCharts.AI projects the next 30 bars forward — for price and for each indicator you have enabled. The projected path and the live direction are generated inside the platform for whichever chart you have open.
See the live ES 1 Minute prediction — 7 day free trialSee live predictions on LiveCharts.AI →
See LiveCharts.AI in action — predicted candlesticks and indicators, 30 bars into the future, before they occur:
Questions traders ask
Short term EMA prediction for next candle Yes. Alongside the regular EMA, LiveCharts.AI draws the predicted EMA for ES on every timeframe from 1 minute to 1 hour, updated as each candle closes. Predictive indicators →
Candle path prediction ES LiveCharts.AI predicts the next 30 candles of S&P 500 E-mini Futures on every timeframe from 1 minute to 1 hour, drawn on the live chart. It is a prediction, not a certainty, so LiveCharts.AI publishes how its recent ES predictions compared with what happened. Candlestick prediction →
Can I ask an AI chatbot about the S&P 500 E-mini Futures chart? A screenshot in a general chatbot shows only one moment. LiveCharts.AI's chart chat reads the live S&P 500 E-mini Futures chart, every new bar and its predicted next candles, so you can ask where ES is predicted to go. Chat with a trading chart →
More questions traders ask
Stocks today S&P 500 E-mini Futures (ES) is live on LiveCharts.AI with the next 30 bars predicted on every timeframe from 1 minute to 1 hour, redrawn as each candle closes. A prediction is an estimate, not a certainty; the market page shows recent ES predictions next to what happened. S&P 500 E-mini Futures predictions →
1000pip builder free trial For S&P 500 E-mini Futures, LiveCharts.AI draws predicted candlesticks and indicators to the right of the live price, and its AI chat answers questions about the ES chart. Predictions are estimates, not certainties. S&P 500 E-mini Futures predictions →
Fxcm live chart The LiveCharts.AI ES chart shows the real S&P 500 E-mini Futures candles together with the predicted next 30 candles and the predicted indicators, drawn ahead of the last bar on every timeframe from 1 minute to 1 hour. S&P 500 E-mini Futures predictions →