LiveCharts.AI › Compare › 10-Minute DM
10-Minute DM: which instruments read best?
DM forecast accuracy on the 10-minute chart, compared across every instrument.
| Instrument | Confidence | Position | Directional |
|---|---|---|---|
| 6E | 58.9% | 65.4% | 50.0% |
| BIT | 52.8% | 65.1% | 60.0% |
| GC | 55.4% | 42.4% | 60.0% |
| M6E | 53.6% | 58.2% | 56.7% |
| MET | 45.8% | 61.6% | 53.3% |
| MGC | 59.6% | 61.7% | 53.3% |
| MNQ | 40.4% | 51.4% | 56.7% |
| NQ | 54.6% | 59.6% | 53.3% |
| SI | 50.0% | 61.7% | 53.3% |
| SIL | 47.6% | 52.7% | 53.3% |
Measured outcomes, refreshed through the session.
On directional accuracy the strongest of these is BIT at 60.0%. Instruments differ in how cleanly they trend, so the same reading is not equally informative on all of them.
How to read this
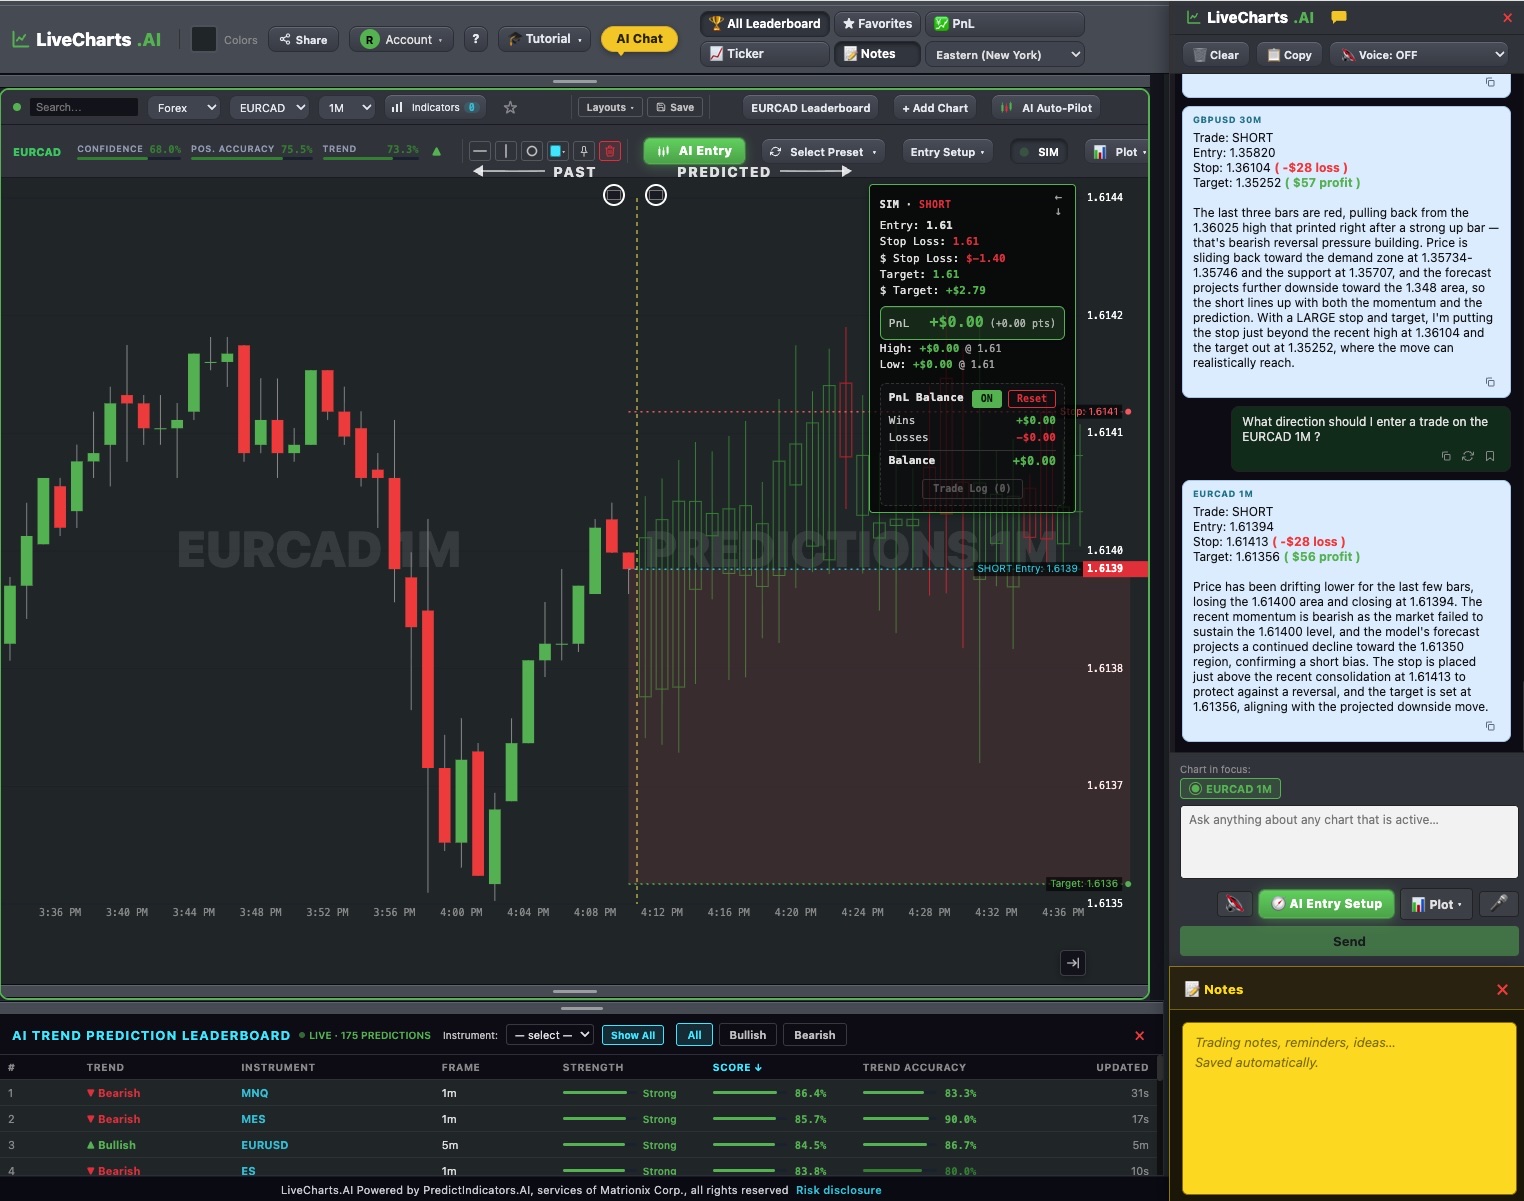
Directional accuracy is how often the projected direction proved right; position accuracy is how closely the projected path tracked what actually happened. Confidence is LiveCharts.AI's own read. The live forecast itself is generated inside the platform.
See the live forecasts — 7-day free trialSee live predictions on LiveCharts.AI →
LiveCharts.AI disclaimer: trading involves risk of substantial loss and is not suitable for every investor. LiveCharts.AI provides technical analysis tools and AI-generated forecasts for educational and informational purposes only; outcomes vary and individual results may differ from any examples shown. Historical performance is not indicative of future outcomes. Only invest capital you can afford to lose and consult a licensed financial advisor before making investment decisions.