AI Chart Chat: Ask Your Stock Chart Anything
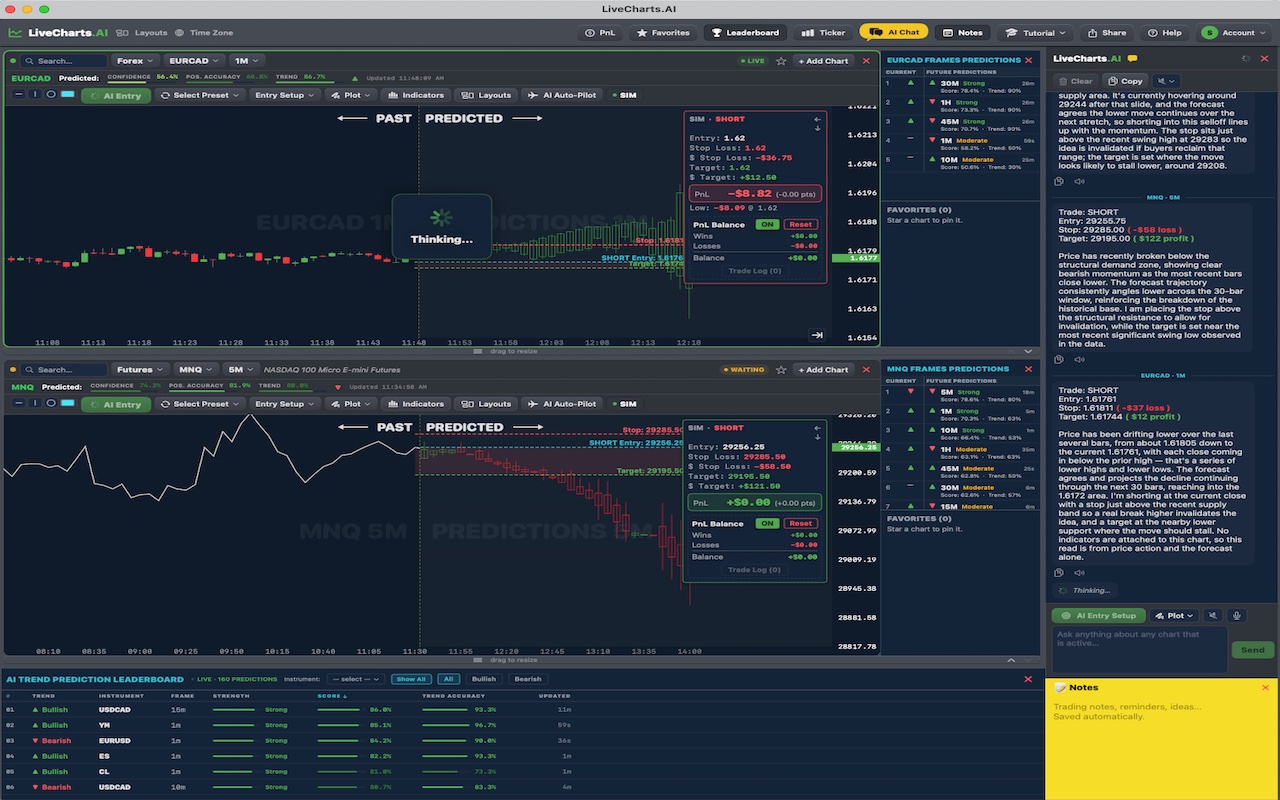
Reading a stock chart takes years of practice — or a good conversation. The free AI chart chat at LiveCharts.AI lets you ask any live US stock chart a question in plain English and get a clear, structured answer, backed by forward looking AI predictions. Pull up a ticker, type "is this holding support?" or "what happens if it breaks this level?", and the chat reads the chart with you instead of making you decode it alone.
Most chart tools are reactive: you upload a screenshot and get a static verdict. This chart chat is different because it works on a live symbol, and it pairs with the 30 bar prediction preview. So when you ask about a level or a trend, the answer references a forward projection that updates as new market data arrives — you are not just describing what already happened, you are looking at where the AI thinks price is headed next.
What the free tool covers: ask the chart chat to explain a candle, a support or resistance level, or an indicator in plain English; watch the forward projection build on the live chart; and follow up naturally until the setup makes sense. "Why would it stall here?" is a perfectly good first question — the chat breaks it into the momentum, the level, and the indicator behavior.
For newer traders, this is where it shines. Instead of memorizing pattern names, you ask a specific question about the chart in front of you and get a straight read you can actually act on. The more you use it, the better you get at reading charts yourself — which is exactly how it is meant to be used, as a tool for learning and informing your own decisions.
Open it at https://livecharts.ai — no install, no sign up to try the chart chat. If it fits how you trade, explore the full free trial to go deeper across more stocks, indices, and timeframes, plus the trade simulator, multi asset dashboard, and the rest of the forward prediction toolkit.
As with everything in LiveCharts.AI, this tool is for educational and informational purposes. Trading stocks involves risk of substantial loss, and no tool guarantees outcomes. Use it to learn and inform your own decisions, and only ever trade capital you can afford to lose.
Try the free AI chart chat and explore free AI trading tools from LiveCharts.AI — see the market before it happens.
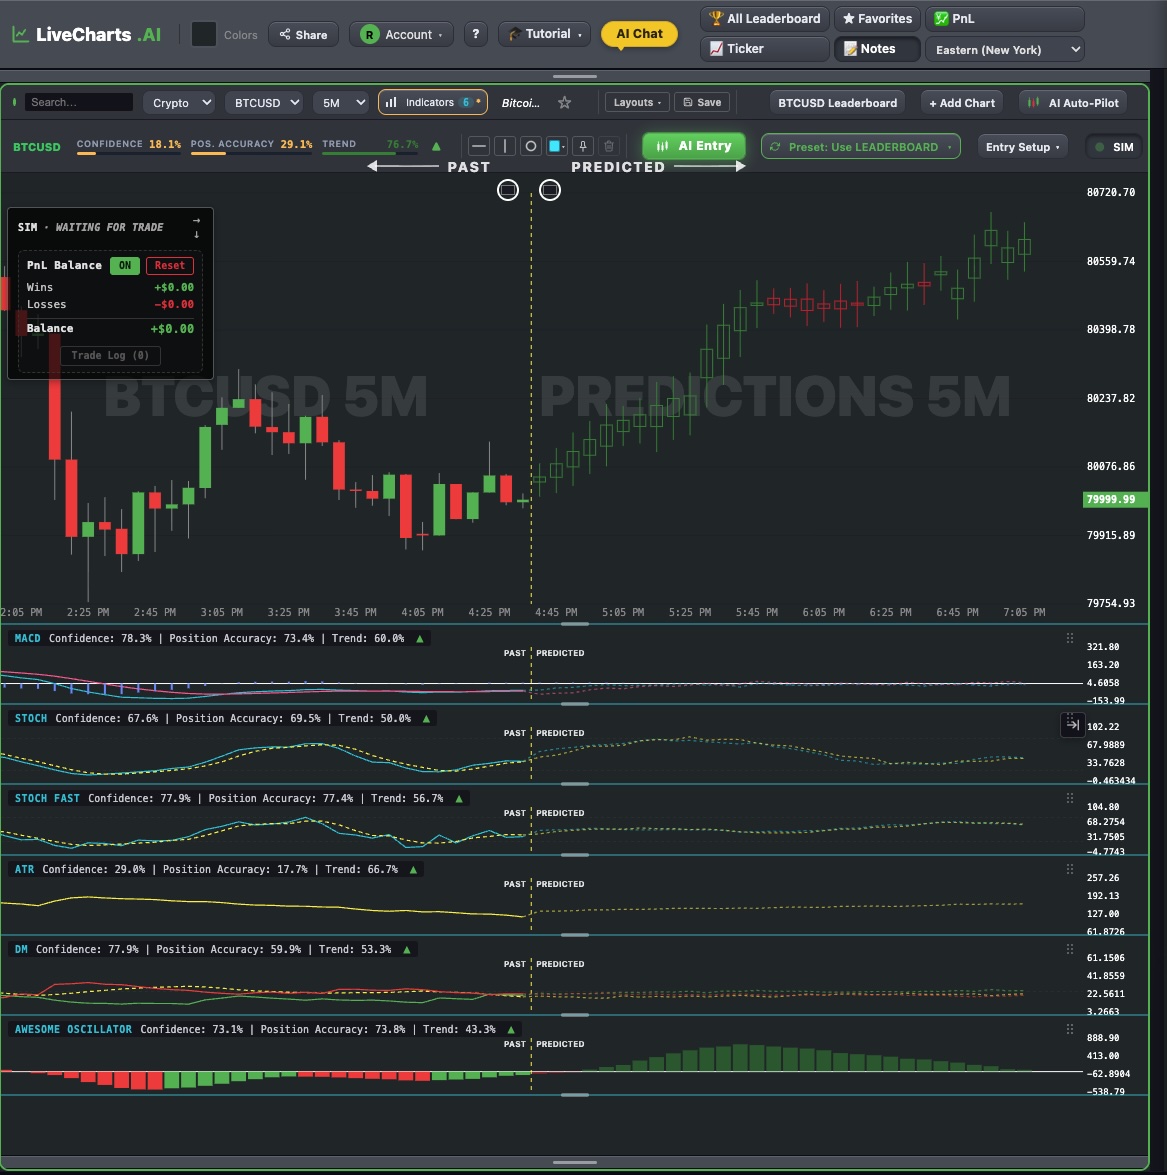
See live predictions on LiveCharts.AI →See LiveCharts.AI in action — predicted candlesticks and indicators, 30 bars into the future, before they occur:
More questions traders ask
Nasdaq e mini futures For E-mini Nasdaq 100 futures, LiveCharts.AI draws predicted candlesticks and indicators to the right of the live price, and its AI chat answers questions about the NQ chart. Predictions are estimates, not certainties. E-mini Nasdaq 100 futures predictions →
QQQ and qqqm E-mini Nasdaq 100 futures (NQ) is live on LiveCharts.AI with the next 30 bars predicted on every timeframe from 1 minute to 1 hour, redrawn as each candle closes. A prediction is an estimate, not a certainty; the market page shows recent NQ predictions next to what happened. E-mini Nasdaq 100 futures predictions →
Invesco QQQ ETF price Open the NQ chart on LiveCharts.AI to see where E-mini Nasdaq 100 futures is now and where its next 30 candles are predicted to go. Past NQ predictions are published next to what the market actually did. E-mini Nasdaq 100 futures predictions →
LiveCharts.AI disclaimer: trading involves risk of substantial loss and is not suitable for every investor. LiveCharts.AI provides technical analysis tools and predictions for educational and informational purposes only; outcomes vary and individual results may differ from any examples shown. Historical performance is not indicative of future outcomes. Only invest capital you can afford to lose and consult a licensed financial advisor before making investment decisions.