When Does M6E (Micro EUR USD Futures) Actually Move? Hourly Ranges on 15 minute Charts
Educational reference. Measured from 5,869 recorded 15 minute bars of Micro Euro FX through November 3, 2026.
10:00 is the busiest hour, averaging 0.0007 per bar — 3.5× the quietest hour at 18:00.
The same stop is a different stop at different times of day. This is the median high to low range of a single 15 minute bar of Micro Euro FX, hour by hour, measured from 5,869 recorded bars over the last 90 days.
| Hour (ET) | Median range | Bars | |
|---|---|---|---|
| 00:00 | 0.0002 | 256 | |
| 01:00 | 0.0003 | 255 | |
| 02:00 | 0.0004 | 254 | |
| 03:00 | 0.0005 | 256 | |
| 04:00 | 0.0005 | 256 | |
| 05:00 | 0.0005 | 256 | |
| 06:00 | 0.0004 | 256 | |
| 07:00 | 0.0005 | 256 | |
| 08:00 | 0.0006 | 256 | |
| 09:00 | 0.0007 | 256 | |
| 10:00 | 0.0007 | 256 | |
| 11:00 | 0.0006 | 256 | |
| 12:00 | 0.0005 | 256 | |
| 13:00 | 0.0004 | 256 | |
| 14:00 | 0.0003 | 256 | |
| 15:00 | 0.0003 | 256 | |
| 16:00 | 0.0003 | 255 | |
| 17:00 | 0.0004 | 64 | |
| 18:00 | 0.0002 | 190 | |
| 19:00 | 0.0002 | 253 | |
| 20:00 | 0.0003 | 253 | |
| 21:00 | 0.0003 | 253 | |
| 22:00 | 0.0003 | 253 | |
| 23:00 | 0.0003 | 255 |
The spread across the day
The busiest hour is 10:00, averaging 0.0007 per bar. The quietest is 18:00 at 0.0002. That is a 3.5× difference across the same instrument, the same timeframe, the same trading day.
A stop sized for 18:00 conditions will be caught routinely at 10:00, and a stop sized for 10:00 gives away far more than it needs to overnight. The same number of points does not mean the same thing at every hour.
See LiveCharts.AI predicting Micro Euro FX live — 7 day free trial →
How this was measured
Every 15 minute bar of Micro Euro FX recorded in the last 90 days was grouped by the hour it opened, in Eastern time. The figure shown is the median of high minus low within each group — the middle bar of that hour, not the average, so a single outlier session cannot distort it. Hours with fewer than 60 recorded bars are omitted rather than shown on thin evidence.
These are recorded market ranges, not predictions. Nothing on this page is a projection.
See live predictions on LiveCharts.AI →
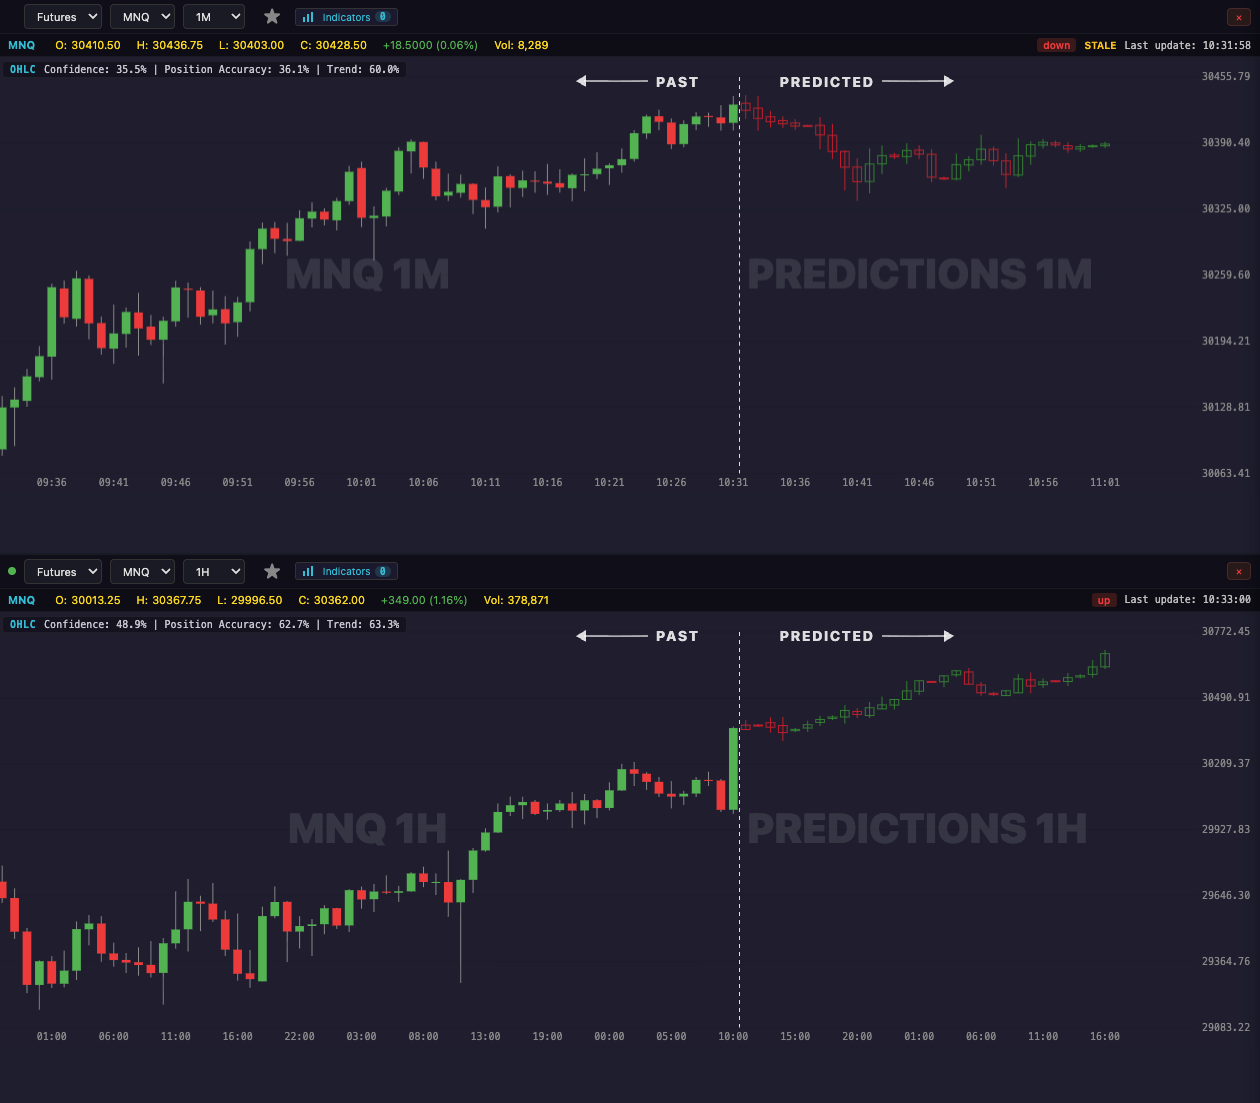
See LiveCharts.AI in action — predicted candlesticks and indicators, 30 bars into the future, before they occur:
Questions traders ask
15 minute candlestick direction for day trading On the 15 minute M6E chart LiveCharts.AI predicts the next 30 candles, about 7 hours ahead, and redraws them as each 15 minute candle closes. Candlestick prediction →
AI trading app with chart explanation for M6E LiveCharts.AI is an AI charting and prediction app built for futures day traders: live M6E charts, predicted candles up to 30 bars ahead and an AI chat that explains the chart, on web, iPhone, iPad and Mac. Futures prediction app →
Measure predicted candle error for M6E AI can give a prediction for M6E, not a certainty. LiveCharts.AI shows its measured record on Micro EUR USD Futures next to each prediction, so its reliability can be checked. Can AI predict futures prices? →