How do predictions help futures day traders? — A Guide for WTI Traders
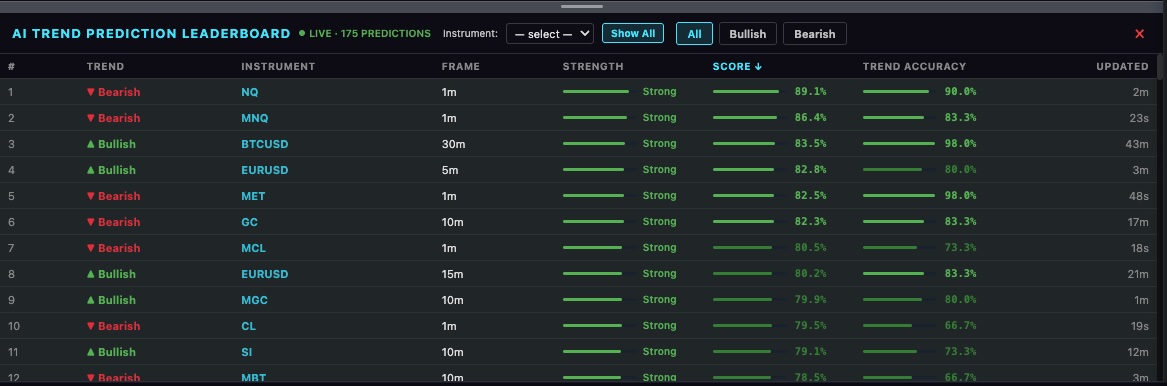
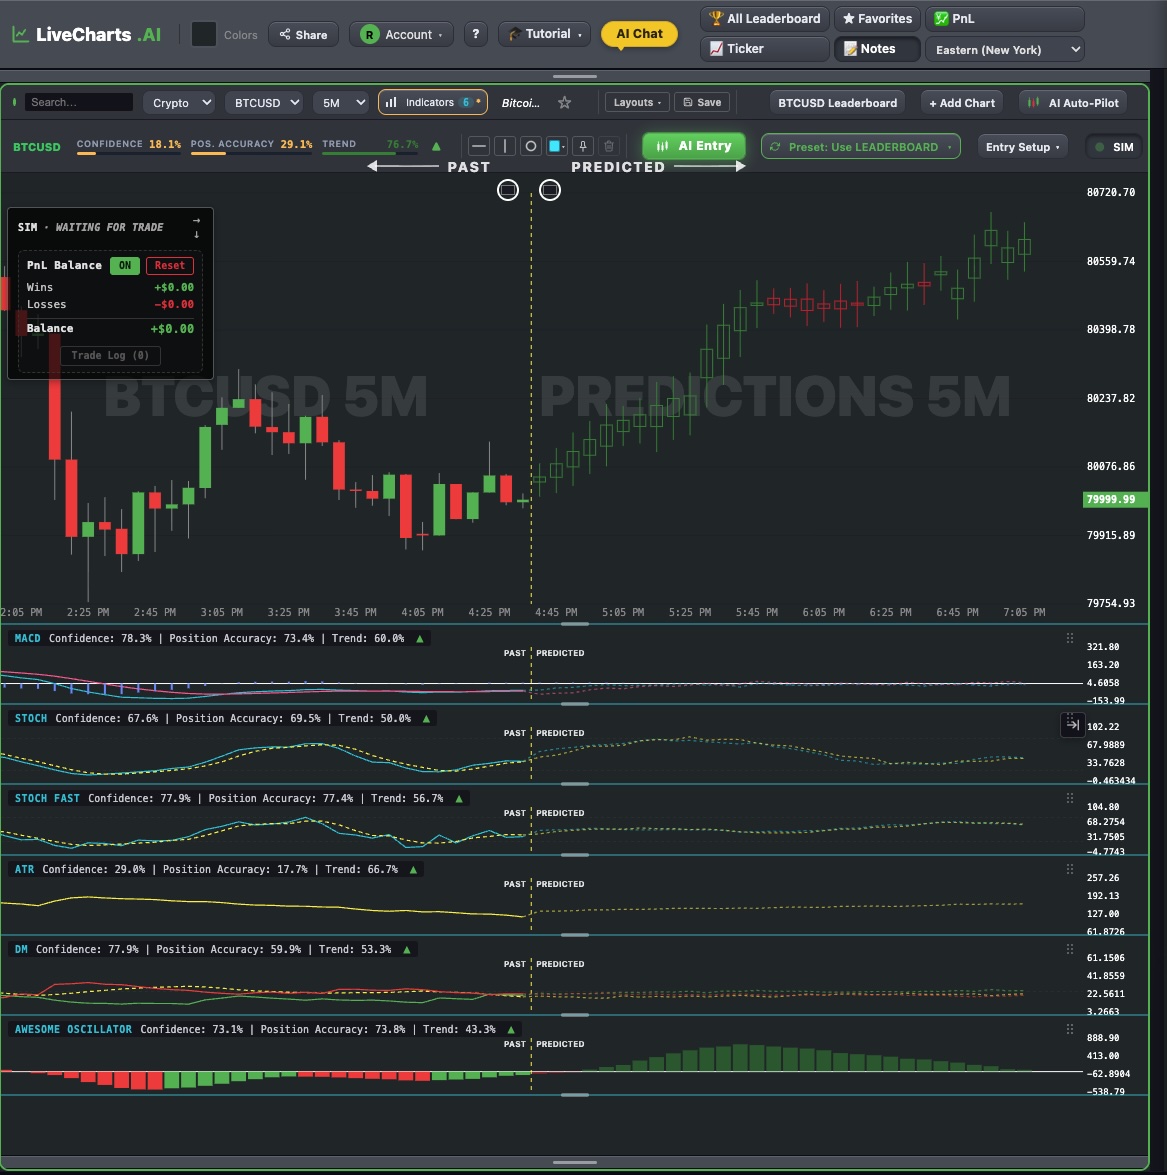
How do predictions help futures day traders? This is one of the questions traders ask most often, and it gets to the heart of what LiveCharts.AI does differently. Instead of only showing history, the platform projects the next 30 bars forward for price and every indicator you have enabled. On a chart of WTI, that means you are looking at a prediction of where things are heading, not just where they have been.
The short version is best understood by opening a chart. When you bring up WTI and look at the forward candles, the AI is reading the same live data you see, then projecting it ahead. The chat feature sits right on the chart, so you can ask questions in plain English and get answers read from that exact projection. There is no separate window or setup to configure — it is part of the chart itself.
Everything in LiveCharts.AI is built for education and information. You can use the AI to ask for a suggested entry, a stop, a target, or a plain language read of a setup, and then track the idea in the built in trade simulator with no money at risk. The goal is to give you more context before you decide, not to replace your own judgment.
If you would like to see it for yourself, open a free trial at https://livecharts.ai and pull up a chart. Ask the chart a question about WTI and watch how it responds using the data on your screen.
A reminder that LiveCharts.AI provides educational tools and information only. Trading involves risk, and no tool removes that risk. Use the platform to understand a setup more clearly and manage your risk with discipline.
Learn the answer to "How do predictions help futures day traders?" and see how LiveCharts.AI works — open a free trial today.
See live predictions on LiveCharts.AI →See LiveCharts.AI in action — predicted candlesticks and indicators, 30 bars into the future, before they occur:
More questions traders ask
RTY futures LiveCharts.AI predicts the path of E-mini Russell 2000 futures (RTY) 30 bars ahead on every timeframe and shows how recent predictions compared with what happened, so the record can be checked before relying on one. E-mini Russell 2000 futures predictions →
E mini russell 2000 futures E-mini Russell 2000 futures (RTY) is live on LiveCharts.AI with the next 30 bars predicted on every timeframe from 1 minute to 1 hour, redrawn as each candle closes. A prediction is an estimate, not a certainty; the market page shows recent RTY predictions next to what happened. E-mini Russell 2000 futures predictions →
Russell futures Open the RTY chart on LiveCharts.AI to see where E-mini Russell 2000 futures is now and where its next 30 candles are predicted to go. Past RTY predictions are published next to what the market actually did. E-mini Russell 2000 futures predictions →
LiveCharts.AI disclaimer: trading involves risk of substantial loss and is not suitable for every investor. LiveCharts.AI provides technical analysis tools and predictions for educational and informational purposes only; outcomes vary and individual results may differ from any examples shown. Historical performance is not indicative of future outcomes. Only invest capital you can afford to lose and consult a licensed financial advisor before making investment decisions.