Using Stochastics Predictions on iPad for 1-hour Swing Setups
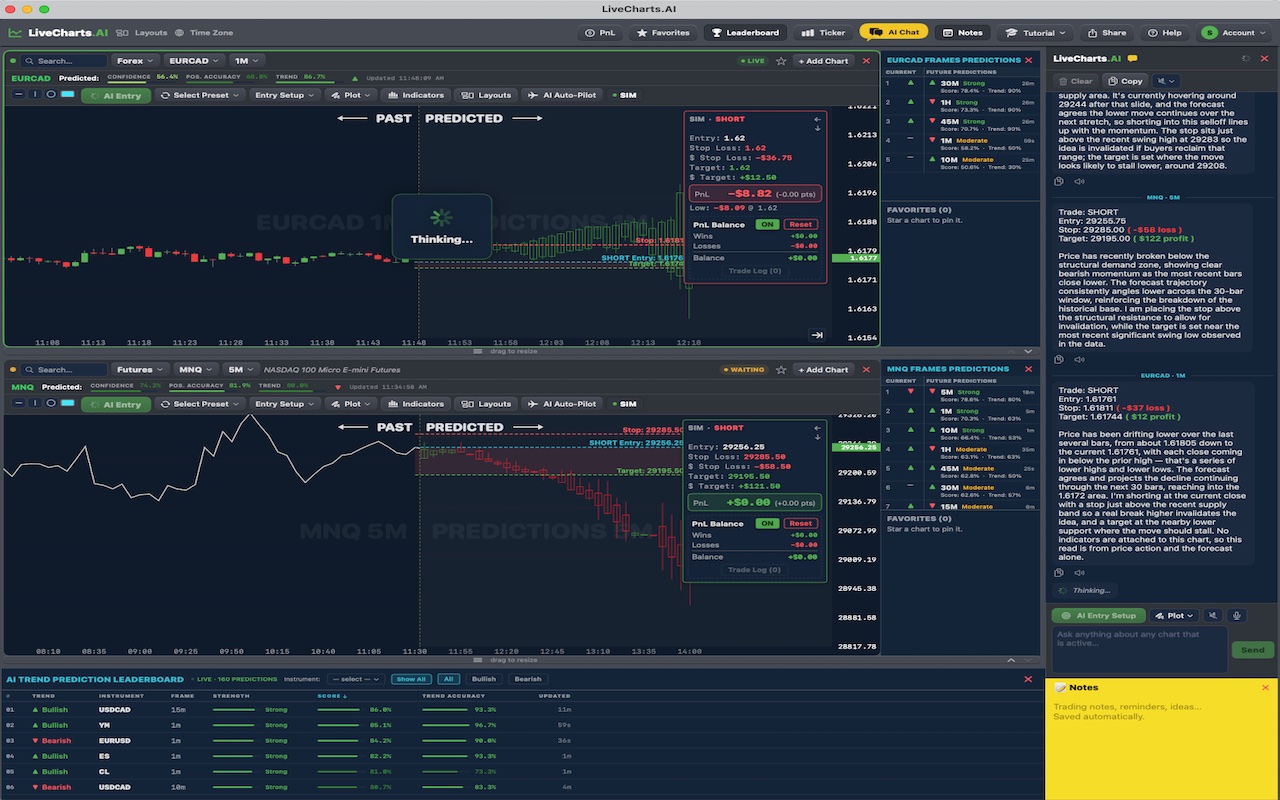
Technical analysis has always been about looking backward and trying to infer what comes next. LiveCharts.AI flips that approach: instead of only plotting what has already happened, it projects the next 30 bars forward for price and every indicator you have enabled. On a 1-hour chart, that forward projection of Stochastics gives you a working view of multi-timeframe alignment before the signals fully print. This guide walks through how traders use those forward reads in futures to build entries with more context and, importantly, to stay disciplined when the market moves against them.
For NG traders, one of the hardest parts of a 1-hour timeframe is deciding whether momentum is actually building or whether the move is already exhausted. A predicted Stochastics reading helps with exactly this. Rather than waiting for a crossover to appear on historical data, you can watch where the indicator is projected to go over the coming bars and compare that against the current trend structure. That comparison is the heart of multi-timeframe alignment, and it is where LiveCharts.AI adds information a conventional chart does not show.
Consider how Stochastics behaves across a 1-hour session. Price moves in waves, and indicators tend to respond to those waves with a lag. When you can see the predicted path of Stochastics thirty bars ahead, you are effectively removing part of that lag from your decision loop. You are not guessing that multi-timeframe alignment might develop — you are looking at a forward projection and judging whether it aligns with your read of the market. That alignment, or divergence from it, is a practical edge for timing 1-hour entries.
Here is how to apply this in practice on a 1-hour chart of NG. First, set up your chart with the indicator panels you care about. LiveCharts.AI will place a dashed PAST | PREDICTED divider on each panel; everything to the right of the divider is the forward projection, not history. Watch whether the predictions for Stochastics point toward multi-timeframe alignment. If the projection lines up with your directional bias, that is supporting evidence. If it contradicts your bias, that is a reason to pause rather than force a trade. This keeps the emphasis on information, not ego.
The 1-hour timeframe rewards attention to multi-timeframe alignment because moves complete quickly and reversals can be sharp. A single candle can erase a large portion of a day's range. Using predicted Stochastics signals helps you anticipate those shifts instead of reacting after price has already moved. That is not a guarantee of outcome — nothing in trading is — but it is a genuine step toward making entries with more foresight and less guesswork.
Many traders make the mistake of treating a single indicator in isolation. The stronger approach is to combine Stochastics predictions with the other panels LiveCharts.AI projects forward — including Stochastics, ATR, ADX, and the Awesome Oscillator. When several forward readings point in the same direction on a 1-hour chart, the confluence is more meaningful than any single signal. That multi-indicator view is available for NG and every other instrument in the picker, and it updates continuously as new market data arrives.
For swing traders working a 1-hour plan on NG, the trade simulator inside LiveCharts.AI is a useful companion to multi-timeframe alignment. You can lay out an entry with a stop and a target, and the simulator tracks it with real contract economics — without risking a single dollar. Over time, this practice reveals which 1-hour setups and which predicted Stochastics signals work for your style. The point is repetition, review, and refinement, not blind trust in any forecast.
The iPad experience is built around the same forward predictions, in a layout that suits the device itself — on an iPad the multi-chart layout lets you stack several timeframes at once. Whether you set up your workspace on iPad or check it on another screen, the multi-timeframe and multi-instrument view of NG stays consistent, so a 1-hour read on your phone or tablet matches what you see at your desk.
If you want to see this for yourself, open a free trial at https://livecharts.ai. You can pull up a 1-hour chart of NG, enable the Stochastics panel, and watch the forward projection build in real time. Then use the live trend leaderboard to see which instruments and timeframes are ranked with the highest confidence. The combination of forward price, forward indicators, and plain-English AI chat on the chart is what makes LiveCharts.AI a different kind of trading workspace.
A final word on risk. Paying attention to multi-timeframe alignment gives you context, and predicted indicators give you information, but neither removes the inherent risk of trading. Set stops before you enter, size positions you can comfortably afford to lose, and treat every 1-hour decision as one you can review later in the simulator. Information is the goal; discipline is the guardrail.
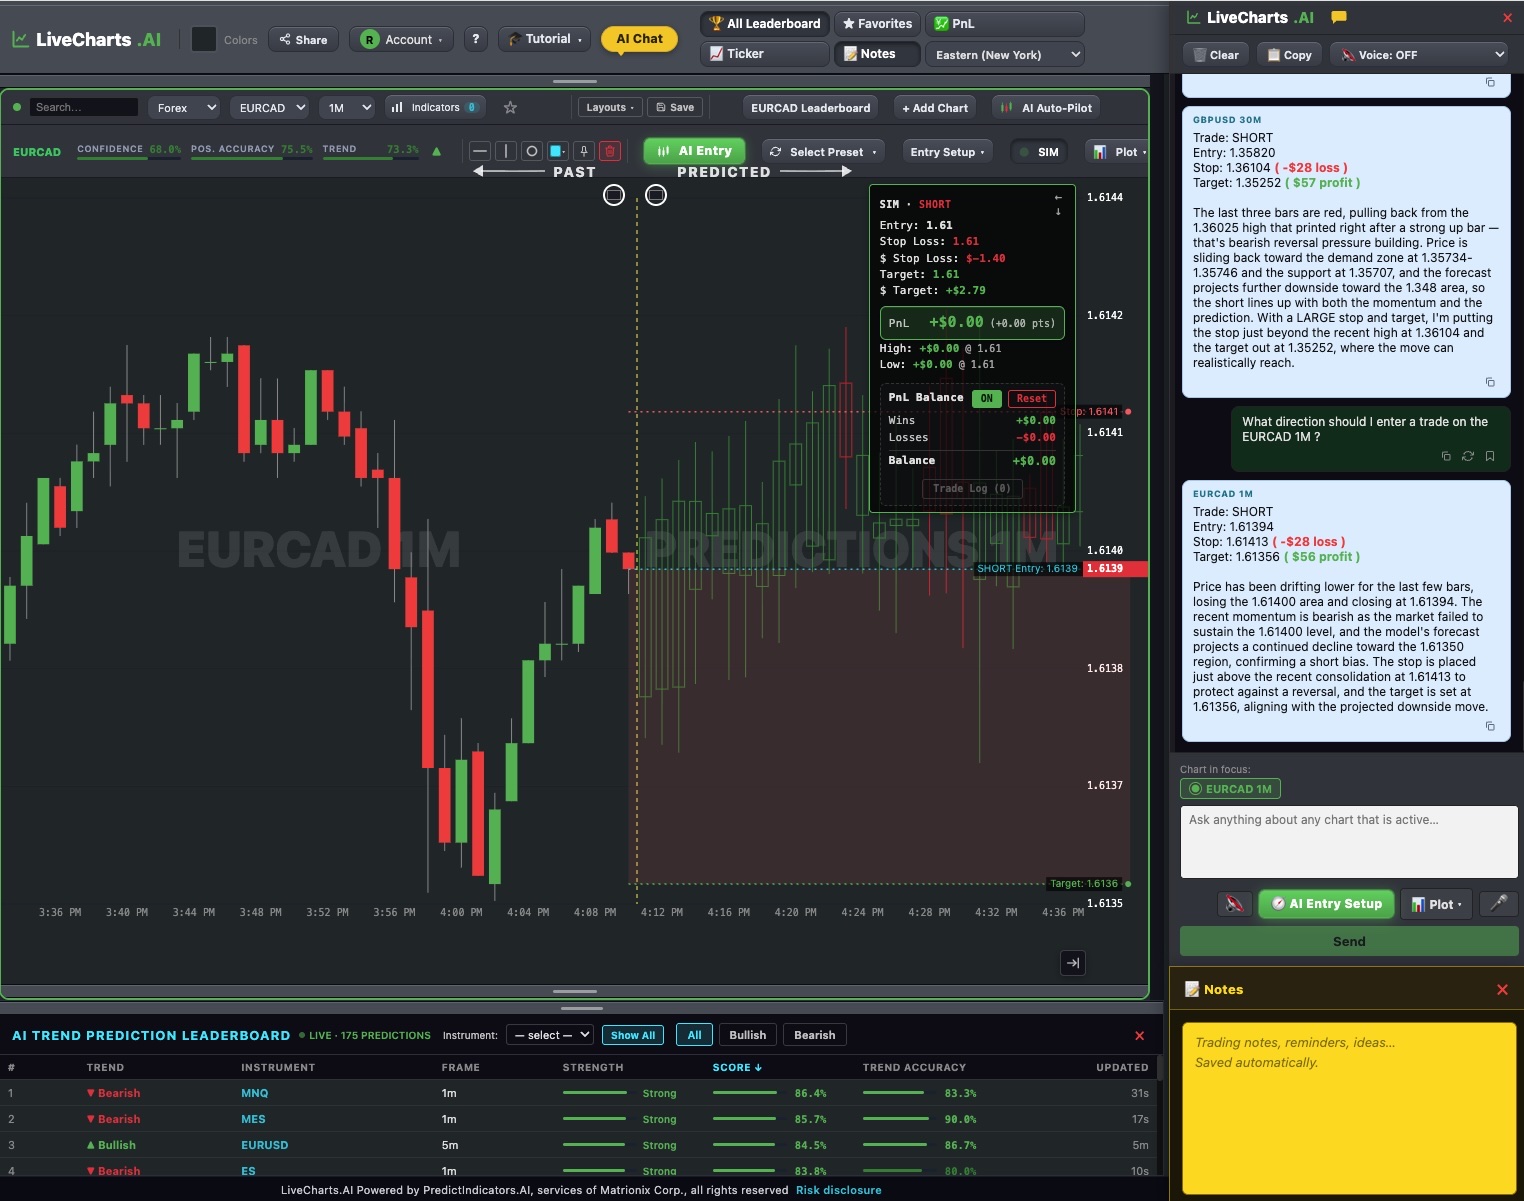
Stochastics predictions on a 1-hour chart of NG are available inside LiveCharts.AI on iPad — see the market before it happens.
See live predictions on LiveCharts.AI →LiveCharts.AI disclaimer: trading involves risk of substantial loss and is not suitable for every investor. LiveCharts.AI provides technical analysis tools and AI-generated predictions for educational and informational purposes only; outcomes vary and individual results may differ from any examples shown. Historical performance is not indicative of future outcomes. Only invest capital you can afford to lose and consult a licensed financial advisor before making investment decisions.